

You have four numbers in front of you and you are about to multiply them together. Where did those numbers come from, and when did anyone last check them?
Pipeline velocity measures how many dollars move through your sales pipeline each day. Multiply your qualified opportunities by average deal size and win rate, then divide by your sales cycle length in days. Fluid CRM holds the four inputs, and you run the math yourself.
What Pipeline Velocity Actually Measures
Pipeline velocity turns your whole sales operation into a single number: dollars per day. Not dollars per deal, not deals per month. Dollars per day, flowing.
That is genuinely useful. If you know your pipeline produces $400 a day, you know a 90-day quarter produces about $36,000 without opening a forecast spreadsheet. You can also test decisions against it, so hire a second closer and watch the number, or raise your prices and watch the number.
The catch is that pipeline velocity compresses four separate measurements into one output. Compression is what makes it easy to say in a meeting, and it is also what makes it easy to hide behind. A velocity of $400 a day could mean plenty of small deals closing fast, or a handful of big ones crawling. Those two businesses need completely different fixes, and the single number treats them as identical.
So read the four inputs alongside the output, always. The number on its own is a headline, not a diagnosis.
One more thing decides whether any of this works. Your pipeline stages have to mean the same thing to everyone entering deals. If “qualified” means one thing to you and another to the person typing, every calculation after that is guesswork. Research published in the Harvard Business Review back in 2015 found companies with a formal, defined sales process grew revenue about 18% faster than companies without one.
That study is a decade old now and the finding has aged well, because the mechanism is boring and permanent. Defined stages produce comparable numbers, and vague stages produce noise. If your stages are still fuzzy, fix that before you calculate anything, and my guide to sales pipeline stages walks through the seven that carry their weight.
Pipeline velocity vs sales velocity
These are the same formula and, for practical purposes, the same metric. Some teams draw a line where pipeline velocity describes movement between stages and sales velocity describes revenue per unit of time. That distinction never survives contact with a real meeting. Pick one word, define it once, use it every month.
Pipeline velocity vs pipeline coverage
These two are genuinely different, and people mix them up constantly. Velocity answers “how fast is money moving?” Coverage answers “do I have enough open pipeline to hit my target at all?” Coverage is usually written as a multiple, and 3x quota is the common rule of thumb.
You can have excellent coverage and terrible velocity. That is a pipeline stuffed with deals that never move, which is one of the most common ways small B2B sales goes wrong and one of the hardest to see from the inside.
The Pipeline Velocity Formula, With A Real Example
The pipeline velocity formula is short:
(Qualified opportunities x Average deal size x Win rate) ÷ Sales cycle length in days
Every input needs a definition you can defend, because a sloppy definition anywhere produces a confident number that means nothing.
Qualified opportunities
The count of open deals that have passed your qualification bar during the period you are measuring. Not leads. Not people who replied to a cold email and said “sure, send info”. Deals where someone with budget authority has agreed there is a real problem worth paying to solve.
If you have no written qualification bar, this input is the first thing to fix.
Average deal size
Total value of your closed-won deals divided by the number of them, over the same period. Use closed-won, not open pipeline value. Open deals carry whatever number the salesperson typed when they were feeling optimistic, and that is not evidence.
Win rate
Closed deals only. Won divided by won plus lost. Open deals are not in the denominator, and this detail matters more than anything else on this page. A deal that is still sitting open, untouched, does not count against your win rate at all. Remember that when you get to the next section.
Sales cycle length
Average days from opportunity creation to close, across deals that actually closed in your period. Won and lost both count, because a deal you lost after 60 days still consumed 60 days.
Running the numbers
Take a small B2B team, the kind I built Fluid CRM for. Two people selling, deals in the low thousands, one quarter of data.
- Qualified opportunities: 18
- Average deal size: $4,200
- Win rate: 22%
- Sales cycle length: 38 days
18 x $4,200 = $75,600 of qualified pipeline. Multiply by 0.22 and you get $16,632 of expected revenue. Divide by 38 days and your pipeline velocity is $438 a day, which extrapolates to roughly $13,100 a month or $39,400 a quarter.
That is the calculation. If you want to skip the arithmetic and just get the number, my sales velocity calculator does all four steps and shows the working.
Now hold onto that $438, because the rest of this post is about how much of it is real.
Why Your Pipeline Velocity Number Is Almost Always Too High
When pipeline velocity is wrong, it is not wrong randomly. Three of the four inputs go wrong in the same direction, and that direction is up.
I spent three years at Fenixtal generating leads for other people’s sales teams. Over 50 B2B clients, 12M€+ pipeline, 1,250+ sales calls. I got to see inside a lot of pipelines from the supply side, and the pattern was almost boringly consistent. Deals I had sourced four months earlier were still sitting in “proposal sent”, still counted as open, still feeding somebody’s forecast.
Counting those as pipeline is like planning the week’s dinners from what is in the back of the fridge. It all looks like food until you check the dates.
Stale opportunities inflate the count
Nobody deletes a deal. Deleting feels like admitting you lost it, so deals stay open indefinitely, and every one of them adds to your opportunity count. Eighteen open deals where six have been silent since March is not eighteen opportunities. It is twelve, plus six pieces of decoration.
Open your pipeline right now. How many of those deals have had anything happen in the last 30 days?
Deals you never marked lost inflate the win rate
This is the one that does the most damage, and it follows directly from how win rate is defined. Won divided by won plus lost. A deal that quietly died but never got marked closed-lost is in neither number, so it simply vanishes from the calculation.
The more losses you fail to record, the higher your win rate looks. Not slightly higher. In our example, 22% came from 5 wins against 18 recorded losses. Mark those 6 abandoned deals as lost and you have 5 wins against 24 losses, which is a 17.2% win rate. Same quarter, same performance, four and a half points of difference produced entirely by admin you did not do.
Deals that drag never enter your cycle average
Sales cycle length is calculated from deals that closed. A deal that has been open for 150 days has not closed, so it contributes nothing to the average. Your slowest deals are structurally invisible to the metric that is supposed to measure slowness.
Only fast deals close on time, so only fast deals get counted, and your cycle length looks shorter than your business actually runs. Everything I saw at Fenixtal says a 38-day recorded average against a real 52 days is the mild version of this gap.
What the corrected number looks like
Apply all three corrections at once. Twelve real opportunities, a 17.2% win rate, a 52-day cycle, deal size unchanged:
12 x $4,200 x 0.172 ÷ 52 = $167 a day
Not $438. The first number was 2.6 times reality, and every part of that gap came from records nobody updated rather than from deals nobody closed.
Average deal size is the honest one, incidentally. It is calculated from closed-won deals only, so neglect does not systematically push it up or down. Three inputs bias upward, one stays neutral, and none of them bias down. That one-way tilt is the whole argument.
Doland White, founder of DWC, described what this looks like before he fixed it:
“Before Fluid, I was tracking prospects, clients, and podcast guests across Google Contacts, LinkedIn, spreadsheets, and marketing platforms. Fluid ended the wasted effort. I go faster, and I can plan my client actions with clarity.”
Four systems, four partial pictures. You cannot compute an honest opportunity count from four places, and neither can anyone else.
Which Pipeline Velocity Lever Is Worth Pulling First
The four levers are opportunity count, deal size, win rate and cycle length. Most advice presents them as equally available, and at 2 to 5 person scale they are nothing of the sort.
Win rate is the noisiest and the worst place to start
With 29 closed deals in a quarter, one extra win moves your rate by about three and a half points. That is not a trend, that is a coin landing. Below roughly 20 closed deals you cannot tell improvement from luck, so any effort aimed at win rate this quarter will be judged by a number that cannot report on it. Track it, do not chase it.
Deal size is the slowest and the riskiest
Raising prices works, and it takes two or three quarters to show up in closed-won data because deals already in flight are priced at the old rate. Worth doing. Not worth doing when you need the number to move by March.
Cycle length is the one you can move this week
It is mostly friction, and friction is mostly logistics. Send pricing before the call instead of after, and stop letting a deal end without a booked next step. Then kill the deals that are already dead so they stop consuming attention. None of that requires a new skill.
Opportunity count is the one with a known method
More qualified conversations at the top is the least clever lever and the most reliable, which is why I wrote up the whole approach in my pipeline generation strategy guide.
Start with cycle length, then opportunity count. Leave win rate alone until you have enough closed deals for the number to mean something.
What Counts As A Good Pipeline Velocity
There is no benchmark worth having, and the reason is arithmetic.
Pipeline velocity scales directly with your deal size, so a company selling $200,000 contracts will post a bigger daily number than a company selling $4,000 contracts even if the second one runs a far better sales process. Comparing them tells you which market they are in, not which team is performing.
Published SaaS benchmarks have a second problem for teams this size. They are built on deal counts far larger than a two-person team will ever run. At 18 opportunities your velocity figure moves several percent when a single deal closes, so quarter-to-quarter comparison against an external average is measuring your sample size, not your performance.
The only comparison that survives is you against yourself. Same definitions, same period length, tracked monthly. If your velocity was $167 a day in Q1 and $210 in Q2, that is a 26% improvement and it means something. A competitor’s $10,000 a day means nothing at all.
One condition on that. The definitions have to be frozen. If you tighten what counts as qualified halfway through the year, your velocity will drop and you will have learned nothing except that you changed the ruler.
Pipeline Velocity FAQ
Monthly for most small B2B teams, quarterly if your sales cycle runs past 90 days. Weekly is too noisy at low deal volume, and you will end up reacting to a single deal closing. The point is the trend line across several periods, not any one reading.
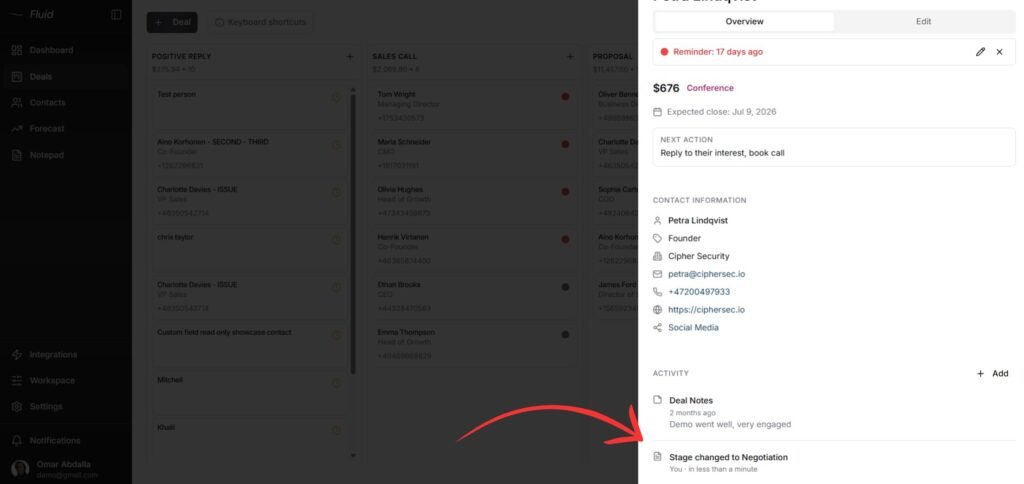
Your CRM supplies the four inputs rather than the answer. Fluid CRM does not display a pipeline velocity figure on a dashboard, and no CRM should be trusted to do it until you know how it treats stale deals. What it does hold is your deal values, your won and lost records and the dates on the deals that closed. One of the 8 in-app automations also writes every stage change into the deal’s activity log, so you can see when a deal entered its current stage and how long it has been sitting there. That covers the formula and the cleanup it depends on. Pull those numbers once a month, run them through the formula and log the result somewhere you will see it again.
In practice, yes. Same formula, same four inputs, same dollars-per-day output. Some teams reserve pipeline velocity for stage-to-stage movement and sales velocity for revenue over time, but the distinction rarely holds up in real reporting. Choose one term and stay with it.
Some teams use “deal velocity” for the same idea applied to a single deal rather than the whole pipeline, measuring how quickly one opportunity moves from stage to stage. It is useful for spotting which specific deals are stalling. It is not a substitute for the pipeline-wide number, because one fast deal tells you nothing about whether the business is healthy.
What To Fix Before Your Next Calculation
Do the boring thing first. Go through your open deals, mark every dead one as closed-lost and record the real close dates on the ones that made it. Then run the formula, and accept that the honest number will be lower and more useful than the flattering one.
Fluid CRM keeps those four inputs in one place, which is the only reason the monthly calculation takes ten minutes instead of an afternoon.
Start your 7-day free trial here, no credit card required.