

You can count dozens of sales metrics, and lists of 20 or more will happily tell you to. The decision in front of a team of three is smaller. Which numbers will you agree to act on when they move?
A small sales team should track six KPIs: revenue won, new deals added, win rate, average deal size, sales cycle length and open deals with no dated next step. Fluid CRM records the numbers behind all six as you work deals, so nobody has to type them up by hand.
What matters is the rule attached to each number, and knowing which numbers a small deal count can’t support.
The 6 Sales KPIs Worth Tracking on a Small Team
These six suit a team of one to ten, the people we built Fluid CRM and our sales team CRM page for. Four are outcomes, which describe what already happened. Two are leading KPIs, which describe what’s coming, and that’s where you can still change the result.
| KPI | How to work it out | Type |
|---|---|---|
| Revenue won | Value of deals marked won in the period | Outcome |
| New deals added | Count of deals created in the period | Leading |
| Win rate | Won ÷ (won + lost) | Outcome |
| Average deal size | Revenue won ÷ deals won, with the median beside it | Outcome |
| Sales cycle length | Median days from added to won | Outcome |
| Open deals with no dated next step | Open deals with an overdue or empty reminder | Leading |
Outside benchmarks come from teams with far more deals than you, so your own history is the fairer test. This is how to read each one against it, and the close rate guide linked below has B2B figures for win rate.
| KPI | Healthy | Watch | Fix |
|---|---|---|---|
| Revenue won | At or above last quarter | Behind at the halfway point | Behind two quarters running |
| New deals added | At or above last quarter | Behind after month one | Behind after month two |
| Win rate | Steady over a long window | Dips for one quarter | Sags across several windows |
| Average deal size | Median steady or rising | Average moves, median doesn’t | Median falls two quarters running |
| Sales cycle length | Steady | Up for one quarter | Up two quarters running |
| Open deals with no dated next step | Zero | A few from this week | Any older than a week |
Revenue won
Revenue won = the total value of deals marked won in the period. It’s the one number here that pays anybody, and also the slowest, because the work behind it happened weeks ago.
Set the rule at the halfway point of the quarter. If you are behind last quarter by then, the owner goes through the deals nearest a decision and asks each buyer what still has to happen before they sign.
New deals added
New deals added = the number of deals created in the period, and only real ones. A contact you met at a conference with no conversation behind it doesn’t count.
This number shows next quarter’s revenue first, because a new deal pays about one sales cycle after it arrives. Agree that if the count is below last quarter by the end of month two, one named person picks a lead source you haven’t tried and runs it before the quarter ends.
Win rate
Win rate = deals won ÷ (deals won + deals lost), counting finished deals only. Our close rate guide covers the formula differences and B2B benchmarks, so I won’t repeat them here.
The agreed rule is different from the others, for a reason the next section shows. Read it over a long rolling window and don’t react to one quarter. When it does sag across several windows, open the last ten lost deals and read why they ended.
Average deal size
Average deal size = revenue won ÷ deals won. Look at the median beside it, because one big client can pull the average up a lot. Eight deals at $5,000 plus one at $40,000 give an average of $8,889, while the median, the middle deal, is still $5,000.
So when the average rises and the median doesn’t, you landed one big deal and your deals did not get bigger. Agree not to plan next quarter’s revenue around that number until the median moves too.
Sales cycle length
Sales cycle length = the median number of days from a deal being added to it being won. This one tells you when to expect money. With a 40-day cycle, deals added this month mostly pay next month or the one after.
If the median climbs two quarters in a row, walk through your last five wins and find the point where each one sat waiting. A cycle that got longer almost always has a specific cause, such as a new approval step on the buyer’s side or a proposal that takes you a week to write.
Open deals with no dated next step
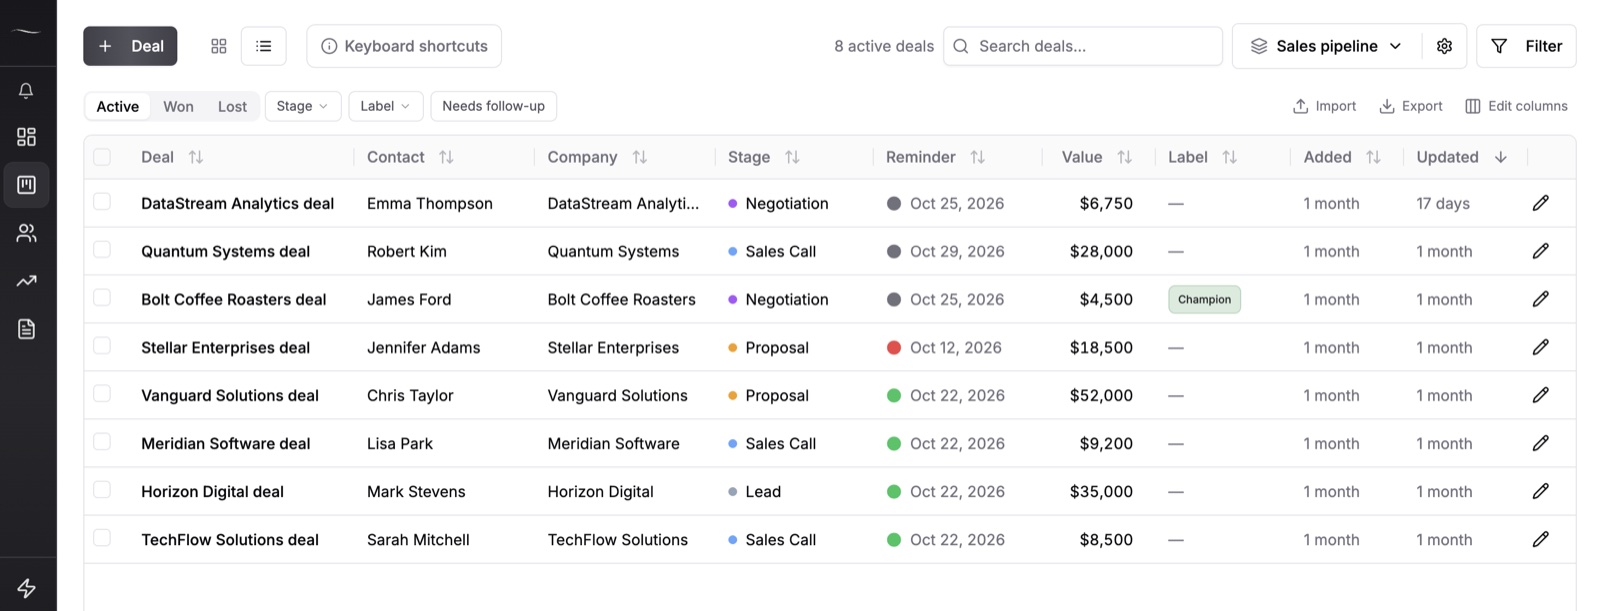
This is a count of open deals where the reminder is overdue or missing, and most KPI lists leave it out. A good number of those deals are already dying while they still add to your pipeline total. Can you name yours right now without opening a tab?
The target is zero, which is why it’s the easiest rule on this list. Every deal in that count gets a new date or gets marked lost. Leads die on the days the CRM stays closed, and a deal with no date gives nobody a reason to open it.
Why pipeline value and lost reasons aren’t on the list
Pipeline value looks healthy when old deals nobody is working still count in the total, so clear the sixth KPI first and then trust it. Lost reasons are useful when you read them, but they explain win rate rather than sitting beside it.

What Makes a Sales Metric a KPI
A sales metric is anything you can count, and a sales KPI (key performance indicator) is a metric you have agreed in advance to act on when it moves. The whole difference is the agreement.
“214 emails sent” is a metric, and nothing follows from it. “If new deals are below last quarter by the end of month two, Sara tests a new lead source” is a KPI, since it has an owner, a trigger and a next move.
That test is also how to cut your own list. Go through each number you look at and write what you would do if it dropped by a fifth. If you can’t write anything, it’s a metric and you can stop reporting it.
Why a Small Team’s Ratios Swing When Nothing Changed
Say your win rate was 30% last quarter and 40% this quarter. It feels like good news, and on a small team it might be one deal.
The table below shows the same 10-point jump at three deal counts. Each bracket is the 95% range, meaning the true rate behind that result probably sits somewhere inside it. It uses a standard statistics formula from NIST, the US standards agency.
| Deals decided each quarter | Last quarter | This quarter |
|---|---|---|
| 10 | 3 won, 30% (range 11% to 60%) | 4 won, 40% (range 17% to 69%) |
| 20 | 6 won, 30% (range 15% to 52%) | 8 won, 40% (range 22% to 61%) |
| 100 | 30 won, 30% (range 22% to 40%) | 40 won, 40% (range 31% to 50%) |
At 10 decided deals, the two ranges cover almost the same ground, so you can’t say anything got better. One late signature would have erased the whole jump. Even at 100 they still overlap, which shows how much data a clean ratio needs.
I don’t think there is a magic deal count where a ratio becomes true, and the table doesn’t give one. What it shows is that the range narrows as deals pile up. For how long to wait before acting on win rate, the close rate guide linked above goes further.
Counts and dollars read differently. A dollar total can swing on one deal too, but that money really arrived, and if new deals fall from 31 to 22, nine fewer deals really did show up. You can act on that today without knowing whether it’s a trend, while a ratio only hints at a change in skill.
Other Sales Metrics and When Each One Starts to Matter
The usual vanity metrics on a small team are calls and emails sent, meetings booked on inbound teams and total pipeline value. The others in this table are good metrics that wait for an event in your business, and until it happens they take reporting time and change no decisions.
Kyler Thompson runs the solo creative studio Knight Theory and has tried more CRMs than he cares to admit. What he wanted from one is a fair standard for a KPI list too.
“A clean, no-frills interface that does what I need and doesn’t annoy me with features that I don’t.”
| Metric | Why it can wait | When it starts to matter |
|---|---|---|
| Calls and emails sent | Counts effort, and effort can rise while revenue falls | A month when new deals keep falling and you need to know if enough outreach went out |
| Meetings booked | Tells an inbound or referral team very little | Already, if outbound is how you get deals. Treat it as the early form of new deals |
| Pipeline velocity | Multiplies win rate and deal size together, so it moves when they do | When those inputs hold steady from quarter to quarter |
| Quota attainment | Needs a target someone is individually held to | When a rep’s pay depends on a number |
| Pipeline coverage | No need for a standing number each week | Check it the moment new deals fall |
| Customer acquisition cost and lifetime value | Referrals and founder time are hard to price honestly | When you start paying for leads |
| Churn | Means little on one-off project work | When your revenue recurs |
| Per-rep comparisons | A team of two gets rankings from a handful of deals. Fluid CRM has no per-user report | When several reps sell the same kind of deal |
| Speed to lead | Doesn’t apply when you start every conversation yourself | Now, if leads come to you through forms. Make it your seventh KPI |
I’m not dismissing meetings booked, by the way. Booked sales calls were the number my old outbound agency, Fenixtal, got hired to produce, 1,250+ of them. For a team selling that way, the calendar is where new deals show up first.
Sales KPI Examples: A 3-Person Team, With Example Numbers
A three-person B2B agency’s six sales KPIs might look like the table below. The team is made up and every number is invented, but the arithmetic holds together. The last column shows where each number comes from in Fluid CRM.
| KPI | Last quarter | This quarter | Rule triggered? | In Fluid CRM |
|---|---|---|---|---|
| Revenue won | $58,000 | $64,000 | No | Reports, then Results |
| New deals added | 31 | 22 | Yes | Deals, Added column |
| Win rate | 30% (6 of 20) | 40% (8 of 20) | No | Reports, then Results |
| Average deal size | $9,667 | $8,000 | No | Reports, then Results |
| Median deal size | $6,000 | $6,500 | No | Deals, Won tab, Export |
| Sales cycle length | 38 days | 41 days | No | Reports, then Results |
| Open deals with no dated next step | 4 | 9 | Yes | Deals, Active tab, Filter, Reminder |
Read it the way this team would. Revenue and win rate both went up, and a quarter that good tempts everyone to change nothing. But two extra wins out of 20 is inside the range from the table above, so the team gives itself no credit for it.
Average deal size fell by $1,667 and it looks like the bad news of the quarter. It isn’t, because last quarter held one $30,000 client and the median actually rose by $500. The team moves on.
The numbers that matter are new deals and undated deals. Nine fewer deals arrived, and with a 41-day cycle that gap reaches revenue next quarter, so the named owner picks a new lead source this week. The nine undated deals each get a date or get marked lost by Friday.
This review is quarterly, and it’s a different job from the weekly check-in. If you want the short Monday version your team reads on a phone, our sales report template has it.
If a deal closed earlier than the day someone clicked Won, change its close date in the deal panel and the Results report follows it, so revenue lands in the right month. Those numbers are only as true as what gets logged, so logging has to stay quick.
Sales KPI FAQ
Sales KPIs are the few sales numbers a team has agreed to act on when they move. Revenue won, new deals added and sales cycle length are common examples. A number with no agreed response is a metric rather than a KPI.
A sales metric is anything you can count, such as emails sent or deals added. It becomes a KPI when you have decided who does what if it moves. All KPIs are metrics, and most metrics should never become KPIs.
Six is enough for most teams of one to ten. Add a seventh only for a clear reason, such as first response time when your leads arrive through forms. If nobody can say what they would do when a number drops, cut it.
Common examples are revenue won per quarter, new deals added per month, win rate, median deal size, median days to close and the number of open deals with no next step. Each one needs an owner and an agreed action to count as a KPI.
Review the full KPI list once a quarter and check the counts weekly. Ratios such as win rate need a long window on a small team, because one or two deals can move them by several points. Deal counts can be acted on right away.
The One Sales Metric to Check Tomorrow Morning
Open deals with no dated next step are the sales metric to check first if six feels like too many. The Reminder filter shows it, and it’s the only number on this list you can fix before lunch.
Each deal in Fluid CRM can hold a dated reminder, and a daily email lists what’s overdue and due that day, while the filter catches deals with no reminder at all. It costs $16 per seat per month, and our sales team CRM page shows how a small team runs it together.
Start your 7-day free trial here, no credit card required.