

Someone tells you a healthy pipeline is 3x your target. You add up your board, divide by your target and get a number you have no way to judge. Is 2.6x a problem or fine? That depends on one number most guides skip.
Pipeline coverage ratio is your open pipeline due to close this quarter divided by your target for the quarter. A healthy ratio is 1 divided by your win rate, so a team that wins 25% of its pipeline needs 4x. Keep your deals in a CRM like Fluid CRM and clear out stale ones before you count.
This guide gives the formula, a table of healthy ratios by win rate and a full example for a team of three.
What Pipeline Coverage Ratio Means and the Formula
Pipeline coverage ratio tells you whether you have enough open deals to hit a sales target. It compares the value of the deals you could still win in a period with the amount you need to sell in that period.
Pipeline coverage ratio = open pipeline due to close in the period ÷ sales target for the period
If your team has $240,000 of open deals due to close this quarter and a quarterly target of $80,000, your coverage is 3x. You will also see it called pipeline to quota ratio or sales pipeline coverage. They all mean the same calculation.
The word that does the work is “due”. A deal with a close date next quarter cannot help you this quarter, so it stays out of the top line. If you keep your deals in a CRM for small sales teams, every deal already has a value and a close date, which is all the formula needs.
If you just want the answer for your own numbers, our free pipeline coverage calculator does the division and shows the gap to a healthy ratio.
Coverage is not the same as speed. Coverage asks whether you have enough pipeline at all, while pipeline velocity asks how fast money moves through it. A team can have plenty of one and very little of the other.
What a Healthy Pipeline Coverage Ratio Is for Your Win Rate
The 3x rule comes from a simple bit of math. If you win one deal in three, you need three times your target in pipeline to land the target. That makes 3x correct for a team with a 33% win rate and wrong for almost everyone else.
Required coverage = 1 ÷ win rate
| Win rate | Required coverage | Pipeline needed for a $100,000 target |
|---|---|---|
| 10% | 10x | $1,000,000 |
| 15% | 6.7x | $667,000 |
| 20% | 5x | $500,000 |
| 25% | 4x | $400,000 |
| 33% | 3x | $300,000 |
| 40% | 2.5x | $250,000 |
| 50% | 2x | $200,000 |
So 3x is somebody else’s win rate. Guides that list a coverage range by industry are really listing typical win rates for those industries, so converting your own win rate gives you a better number than any range. A team that wins 20% of its pipeline and aims for 3x will miss its target every quarter while the dashboard says everything looks fine.
Use your own win rate from your last two to four quarters of closed deals. Count lost deals and deals that quietly died, not only the ones someone formally closed, or the rate comes out too high and the target coverage too low.
Measure the win rate the same way you measure coverage. For coverage in dollars, use win rate by value, which is the value of won deals divided by the value of all closed deals. For coverage in deals, use win rate by count. Mixing the two gives you the wrong multiple whenever your small deals win more often than your big ones.
No history yet? Start with 4x, which assumes you win one deal in four, and call it a guess. Replace it with your own number once you have about ten closed deals, counting both won and lost.
How to Calculate Pipeline Coverage: A Worked Example for a Team of Three
Here is a made-up team of three, Ana, Ben and Cara, selling a service with an average deal of $6,000. Their win rate by value over the last four quarters is 25%.
Set the target and the period
The team’s target this quarter is $90,000, split evenly at $30,000 each. Match the period to the target, so a quarterly target gets quarterly coverage.
Keep only the deals that can close in time
Their board shows $310,000 of open deals. Six of those deals, worth $42,000, have close dates next quarter, so they come out.
Remove the deals that are no longer alive
Seven more deals, worth $36,000, have had no reply or activity in over 60 days. This team usually closes in about 30 days, and sixty days is our own rule of thumb for this team’s sales cycle and not a standard, so pick a cut-off that is about twice your normal cycle. Those deals come out too, which leaves $232,000.
Divide by the target
| Person | Open deals due this quarter | Value | Target | Coverage |
|---|---|---|---|---|
| Ana | 14 | $84,000 | $30,000 | 2.8x |
| Ben | 10 | $100,000 | $30,000 | 3.3x |
| Cara | 8 | $48,000 | $30,000 | 1.6x |
| Team | 32 | $232,000 | $90,000 | 2.6x |
Compare it with 1 ÷ win rate
At a 25% win rate the team needs 4x, which is $360,000. The raw board said 3.4x and looked healthy against the 3x rule. The real number is 2.6x against a 4x target.
Work out the gap in deals
The gap is $128,000. At $6,000 a deal, that is about 21 more qualified deals due this quarter, and most of them need to land on Cara’s side of the board. To plan backwards from a target to the pipeline and number of deals it needs, use our sales pipeline calculator.
Count Coverage in Deals, Not Just Dollars
A small team has a problem the big-company guides never mention. With 30 open deals, one large deal can make the whole ratio look safe.
Look at Ben. His 3.3x includes a single $40,000 deal. Without it he has $60,000 on a $30,000 target, which is 2x, and the team drops from 2.6x to 2.1x.
If your biggest deal died tomorrow, what would your coverage be?
That is why it helps to count coverage in deals as well as in dollars. Divide your target by your average deal size to get the number of deals you need to win. Then compare it with the number of open deals you have due in the period.
For this team, $90,000 at $6,000 a deal means 15 wins. They have 32 open deals due this quarter, so deal coverage is 2.1x. Their win rate by count is 30%, because the small deals close more often, so they need 1 ÷ 30%, which is about 3.3x or 50 open deals.
That is 18 more open deals than they have, fewer than the 21 from the dollar gap because their open deals average $7,250, above the $6,000 they usually win.
Both views tell the same story, and the deal view tells it without Ben’s big deal hiding the problem. When a single deal makes up more than a quarter of anyone’s pipeline, report coverage with and without it. A quarter is our own rule of thumb and not a standard.
Stale Deals That Inflate Pipeline Coverage
Coverage is only as honest as the board under it, and most boards are padded. In the example, $78,000 of the $310,000 should never have been counted, and the team would have read 3.4x as a good quarter.
At Fenixtal we booked 1,250+ sales calls for cold email clients. The leads those calls created often ended up in messy spreadsheets or in a CRM nobody liked opening, so any pipeline total built on them was mostly guesswork.
Three things pad coverage again and again.
- Deals nobody marked as lost. A prospect stops replying and the deal sits in Proposal sent for three months, still counting at full value.
- Close dates that keep sliding. A deal that was due last month gets no new date and quietly stays in this quarter’s total.
- Stages that mean different things to different people. If one person moves a deal to Proposal after a call and another after sending a price, the board is not measuring one thing. Fix that first with clear sales pipeline stages.
Tim Chorlton, a one-man-band with an external salesperson, deals with the first problem by moving deals out of his working pipeline instead of letting them sit. Leads that stop responding go into a separate “move to marketing” pipeline, and he exports them from there to his marketing tool.
“You can set up multiple pipelines and move a ‘deal’ between them.”
The board he works from only holds deals that are still alive, so any total he takes from it means something. A weekly sales pipeline review is the easiest place to do the same clean-out as a team.
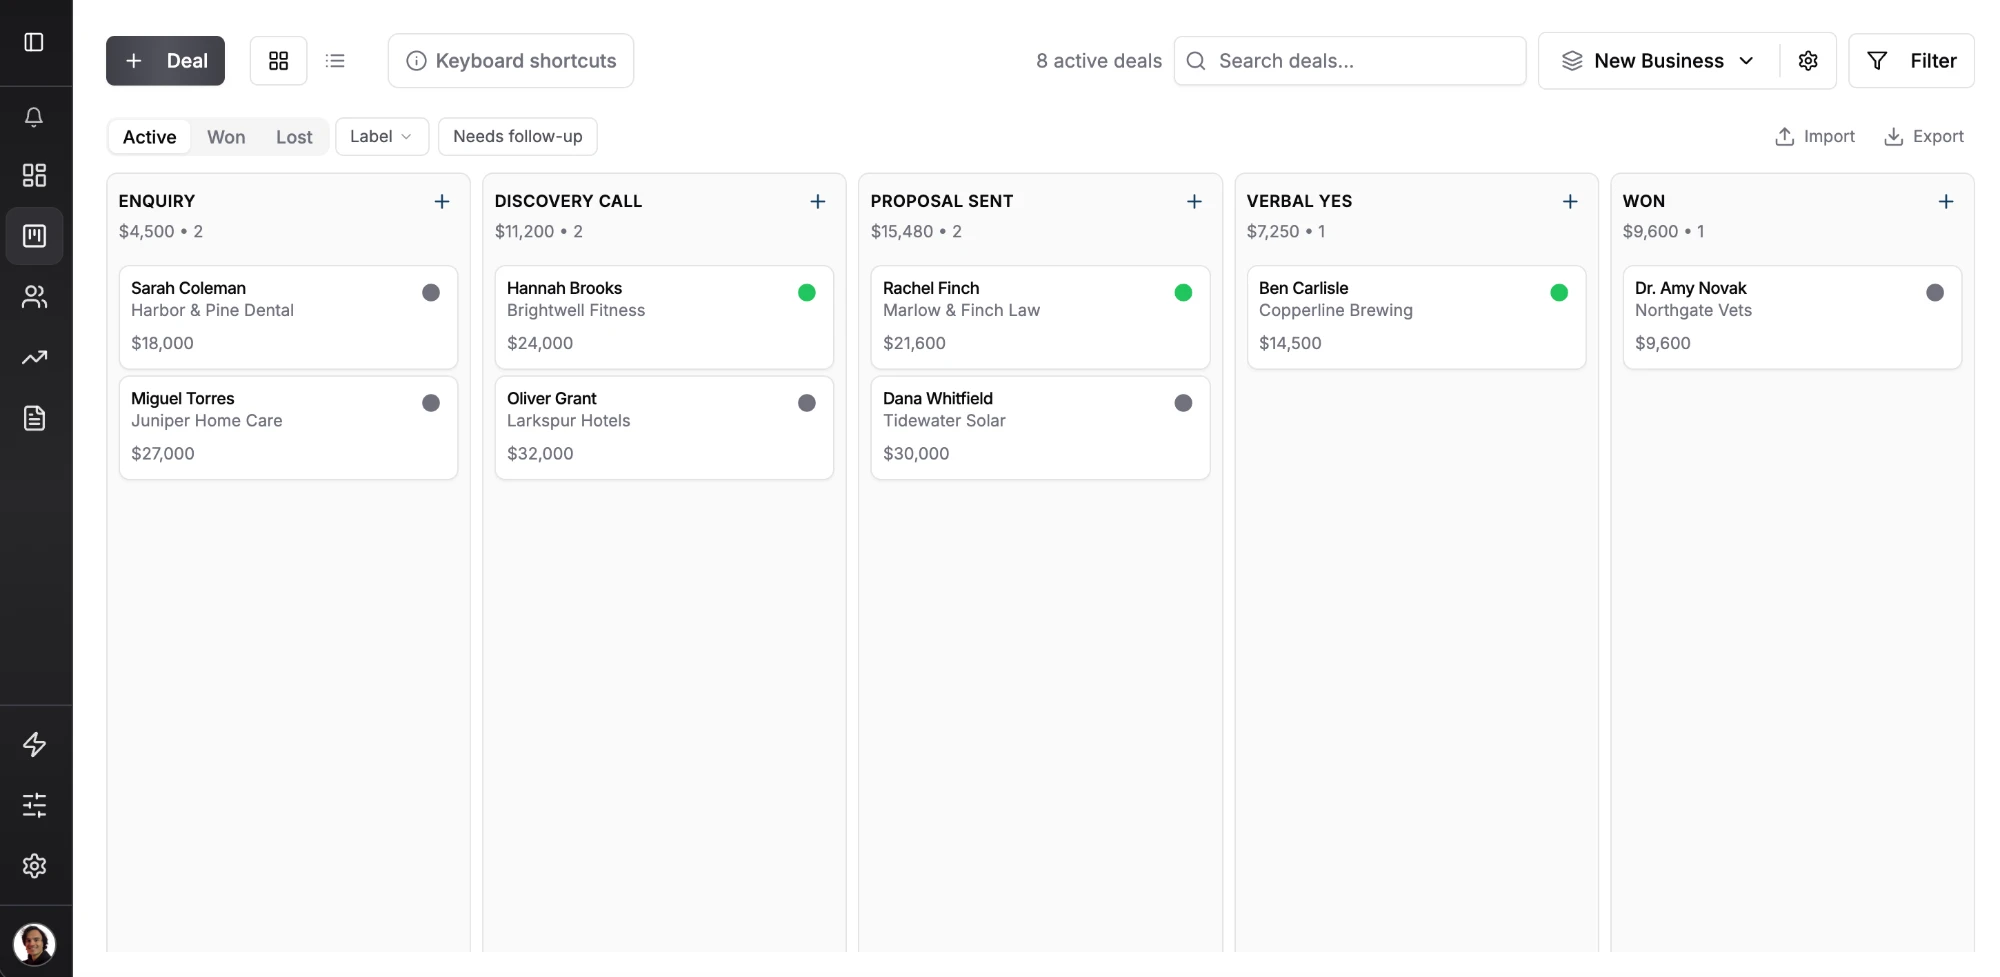
In Fluid CRM the board has Active, Won and Lost tabs, so marking a dead deal as lost takes it out of the active view without deleting its history. One trap when you take numbers from the board is that each column total is weighted by its stage’s chance of closing, so adding up the columns gives you a smaller, weighted figure, and the Won column counts at 100%. For coverage you want the full value of the open deals only.
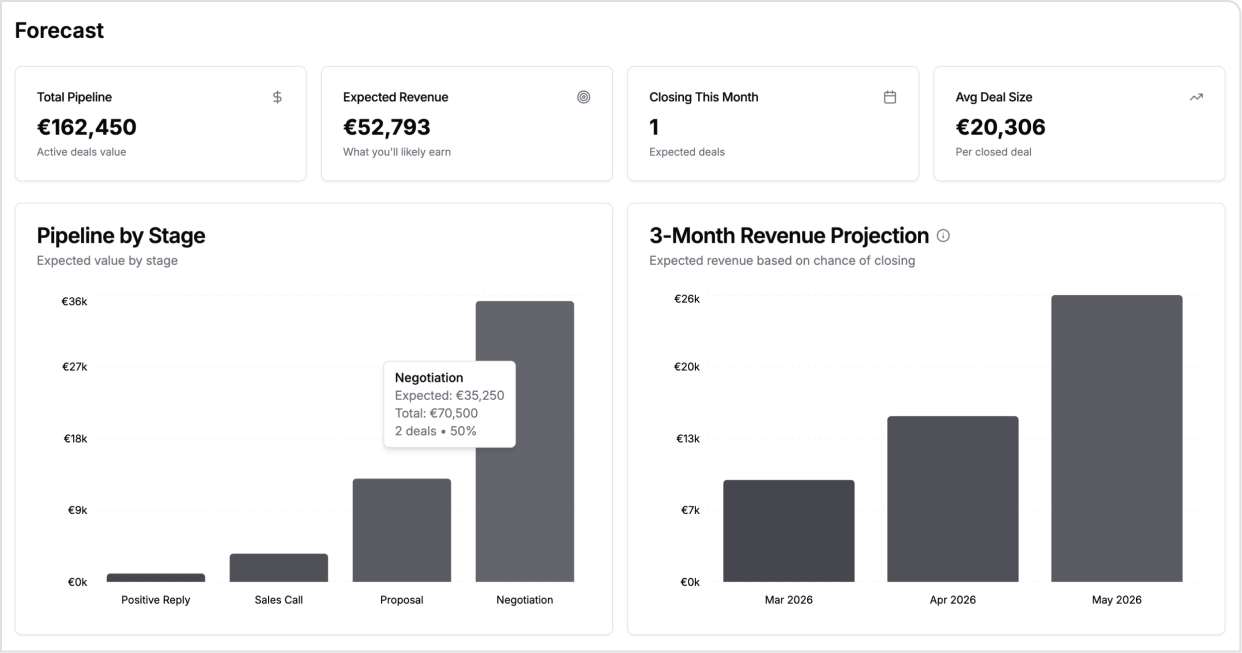
The forecast screen shows the full value of every active deal as Total Pipeline, next to Expected Revenue and a 3-month revenue projection. That total still includes deals due in later quarters, so it is your starting $310,000 and not your $232,000.
Fluid CRM does not show a coverage ratio itself, so you divide the open value due in your period by your target.
A very high ratio is a warning too. If your number comes out at 6x or more with a win rate above 20%, the likelier story is a board full of deals that stopped moving, not a team that is about to have a record quarter.
When Pipeline Coverage Is the Wrong Number to Watch
Coverage is useful for some teams and close to useless for others. Skip it, or measure it differently, in these cases.
- Your deals close within a couple of weeks. Most of this quarter’s sales do not exist yet on the first day of the quarter, so quarterly coverage looks terrible every time. Measure it monthly instead, or watch how many new deals you add each week.
- You have fewer than about five open deals. One deal is 20% of the board, and a ratio built on five deals moves more from luck than from anything you did.
- You have no target. Coverage is a comparison with a target, and without one the number has nothing to be compared with.
For everyone else, it is the quickest early warning a small team has. It tells you in week one that the quarter is short, while there is still time to fill the gap.
Pipeline Coverage FAQ
A good pipeline coverage ratio is 1 divided by your win rate. A team that wins 25% of its pipeline needs 4x and a team that wins 50% needs 2x. The common 3x rule only fits a win rate of about 33%.
Add up the value of the open deals due to close in the period, then divide by your sales target for the same period. Remove deals with later close dates and deals that have had no activity for a long time before you divide.
Yes. Pipeline to quota ratio, sales pipeline coverage and pipeline coverage ratio all describe the same calculation. Quota is simply the word larger sales teams use for the target.
It is enough only if you win about one in three of your deals. With a 20% win rate you need 5x, so 3x would leave you short. Work out your own win rate from your last few quarters before you trust any rule.
Standard coverage uses the full value of open deals and compares it with 1 divided by your win rate. Weighted pipeline already multiplies each deal by its chance of closing, which makes it a forecast rather than a coverage number. A weighted figure should land close to 1x your target if you are on track.
Check Your Pipeline Coverage This Week
Take your open deals due this quarter, remove the ones with later close dates and the ones nobody has touched in weeks, then divide by your target and compare the result with 1 divided by your win rate. If you have more than a few people, do it per person and once without your biggest deal. If you want a forecast on top, the sales forecasting guide shows the weighted method step by step.
Fluid CRM is a simple CRM for small sales teams that keeps the board, the forecast and the 3-month projection in one place, at $16/seat/month or $144/seat/year with every feature on the one plan.
Start your 7-day free trial here, no credit card required.