

Someone on the team asks what you will close next month, and the honest answer is a shrug and a number that feels about right. Most guides answer that with six methods written for a company that has a finance department. You need one method and a table.
Sales forecasting for a small team means multiplying each open deal’s value by the chance of closing for its stage, then adding the results by the month each deal should close. With about ten open deals, a team of 2 to 10 can do it in about 20 minutes from the board it keeps in a CRM like Fluid CRM.
This guide shows the method with a full example, how to pick the percentages when you have only a few closed deals and when you can skip forecasting altogether.
What Sales Forecasting Is and the One Method a Small Team Needs
A sales forecast is the amount you expect to close in each of the next few months, worked out from the deals you have open today.
It helps to keep three numbers apart. Your target is what you want to sell, your pipeline value is every open deal added up at full price and your forecast is what you expect to close once you admit that most open deals will not.
At Fenixtal we generated 12M€+ in pipeline for 50+ B2B clients. That figure is pipeline and not revenue, because a deal on a board is a chance and not a sale.
The method that fits a small team is the stage-weighted forecast, which you will also see called a weighted pipeline or opportunity stage forecasting. You take each open deal, multiply its value by the chance that a deal at that stage ends up won and add the results together by the month you expect each deal to close.
Forecast = sum of (deal value × chance of closing for its stage)
You need three things for every deal, which are its value, its stage and the month you expect it to close. If you keep deals on a board in a sales CRM for small teams, you already have the first two.
The stages have to mean the same thing to everyone, or the percentages mean nothing. If yours are fuzzy, fix them first with this guide to sales pipeline stages.
A Sales Forecast Example You Can Copy
Here is a made-up team of three with ten open deals. Their pipeline has four open stages and each stage has a chance of closing, with Enquiry at 10%, Discovery call at 20%, Proposal sent at 30% and Verbal yes at 50%.
These percentages are a starting point and not a benchmark. No standard set exists, and the same stage gets a different number in every guide you read. The next section shows how to work out your own.
| Deal | Value | Stage | Chance | Weighted value | Close month |
|---|---|---|---|---|---|
| Alder Dental | $10,000 | Verbal yes | 50% | $5,000 | April |
| Birch Logistics | $8,000 | Proposal sent | 30% | $2,400 | April |
| Cedar Accounting | $5,000 | Proposal sent | 30% | $1,500 | April |
| Dune Fitness | $12,000 | Proposal sent | 30% | $3,600 | May |
| Elm Property | $6,000 | Discovery call | 20% | $1,200 | May |
| Fjord Hotels | $20,000 | Proposal sent | 30% | $6,000 | May |
| Grove Legal | $10,000 | Discovery call | 20% | $2,000 | June |
| Heron Vets | $4,000 | Discovery call | 20% | $800 | June |
| Iris Solar | $15,000 | Enquiry | 10% | $1,500 | June |
| Juno Brewing | $5,000 | Enquiry | 10% | $500 | June |
| Total | $95,000 | $24,500 |
Now add the weighted values by month.
| Month | Open deals at full value | Forecast |
|---|---|---|
| April | $23,000 | $8,900 |
| May | $38,000 | $10,800 |
| June | $34,000 | $4,800 |
| Total | $95,000 | $24,500 |
How to fill in the table
Start with a blank copy of the first table. These six columns are all it needs.
| Deal | Value | Stage | Chance | Weighted value | Close month |
|---|---|---|---|---|---|
- List every open deal with its value and its current stage.
- Write the chance of closing for that stage in the fourth column.
- Multiply value by chance to get the weighted value.
- Write the month you honestly expect a yes or a no.
- Add the weighted values for each month.
Deals you have already won stay out of the table. They are sales you have made, so they belong in this month’s results and not in a forecast of what is still open.
If you would rather not do the multiplying by hand, our free sales forecasting calculator does it for you.
How to read the result
The team has $95,000 in open deals and should expect about $24,500 of it over three months. That gap is the whole point of a forecast, because planning a hire around $95,000 would be planning around money that mostly never arrives.
No single month will land on its number. A deal closes at full value or at zero, and with only ten open deals one deal landing a month late changes the whole month. Over several months the totals come out close when the percentages are honest.
June looks thin at $4,800, and that is useful to know in April. It tells the team that June depends on deals that are barely started, so the work this month is finding new ones.
How often to redo it
Rebuild the forecast once a month and update it once a week. The weekly update is quick if you do it during your pipeline review, where stages and close months get corrected anyway. That same weekly slot is a good time to send the five numbers in our weekly sales report template.
At the end of each month, put what you really closed next to what you forecast. After three or four months you will see if your percentages are too hopeful, and that comparison teaches you more than any formula.
How To Choose Honest Stage Percentages From a Few Closed Deals
A stage percentage tells you how many of the deals that ever reached a stage ended up won.
You can work it out from your own history, even a short one. Take your last 30 closed deals and follow two rules while you count.
- Count closed deals only, both won and lost. Open deals have no result yet, so they stay out.
- A lost deal counts for every stage it passed through. A deal that died after the proposal still reached Enquiry, Discovery call and Proposal sent.
Say 3 of those 30 deals were won. For each stage, divide the wins by the number of deals that reached it.
| Stage | Deals that reached it | Won | Share won | Use |
|---|---|---|---|---|
| Enquiry | 30 | 3 | 10% | 10% |
| Discovery call | 15 | 3 | 20% | 20% |
| Proposal sent | 9 | 3 | 33.3% | 30% |
| Verbal yes | 6 | 3 | 50% | 50% |
Three wins is a small sample, so one extra win or loss would move these numbers a lot. That is why you round each one to the nearest 10 and count again every quarter as more deals close.
One more rule keeps you safe. Never put 100% on an open deal, even at a stage where you have won every deal so far, and use 90% at most.
What to do with fewer than ten closed deals
With fewer than ten closed deals you do not have enough history to count. Start with a cautious guess, such as the four numbers in the example, and treat it as a guess.
Then replace the guess with your own count as soon as you can. Every deal you close as won or lost makes the next forecast a little more honest.
Do not use an industry average instead. A published win rate comes from other companies with other prices and other buyers, and we could verify only one for our list of sales statistics.
Three Mistakes That Wreck a Small Sales Forecast
A small forecast usually fails because of what is on the board when you start adding up, and rarely because of the math.
Deals with no close date
A deal without a close month cannot go into any month’s total. It either gets left out or gets dumped into the current month, and both make the forecast wrong.
Give every open deal a month, even a rough one. A rough month you correct later is better than a blank.
Old deals nobody closed as lost
Open your board and look at the oldest deal in each stage. When did that person last reply to you?
A deal that has been silent for two months still gets its stage percentage, so a dead $12,000 proposal still adds $3,600 to your forecast. Close it as lost and reopen it if the buyer comes back.
Leaving dead deals open also makes your win rate look better than it is, which then inflates your percentages. We covered why in this post on pipeline velocity.
One big deal counted as certain
Look at May in the example. Fjord Hotels is worth $20,000 and adds $6,000 to a May forecast of $10,800, which is more than half of the month.
That $6,000 will never happen. Fjord Hotels will pay $20,000 or nothing, so May will end near $4,800 without it or near $24,800 with it.
When one deal makes up more than half of a month, take it out and report it on its own line. Half is our own rule of thumb and not a standard. For this team, May reads as $4,800 from the other deals plus one $20,000 deal that is a yes or a no.
Where to Keep a Sales Forecast: Spreadsheet or CRM
For one person with a handful of deals, Google Sheets or Excel is enough. Copy the six columns above, add a formula for the weighted value and you are done.
The sheet gets harder with a team. Stages change in one place and the forecast sits in another, so somebody has to copy deals across every week, and the forecast is only as current as that person’s last update.
In Fluid CRM each stage has a win probability, and the total at the top of each column on the board is weighted by it. On our demo board, two enquiries worth $45,000 together show as $4,500 because that stage is at 10%.
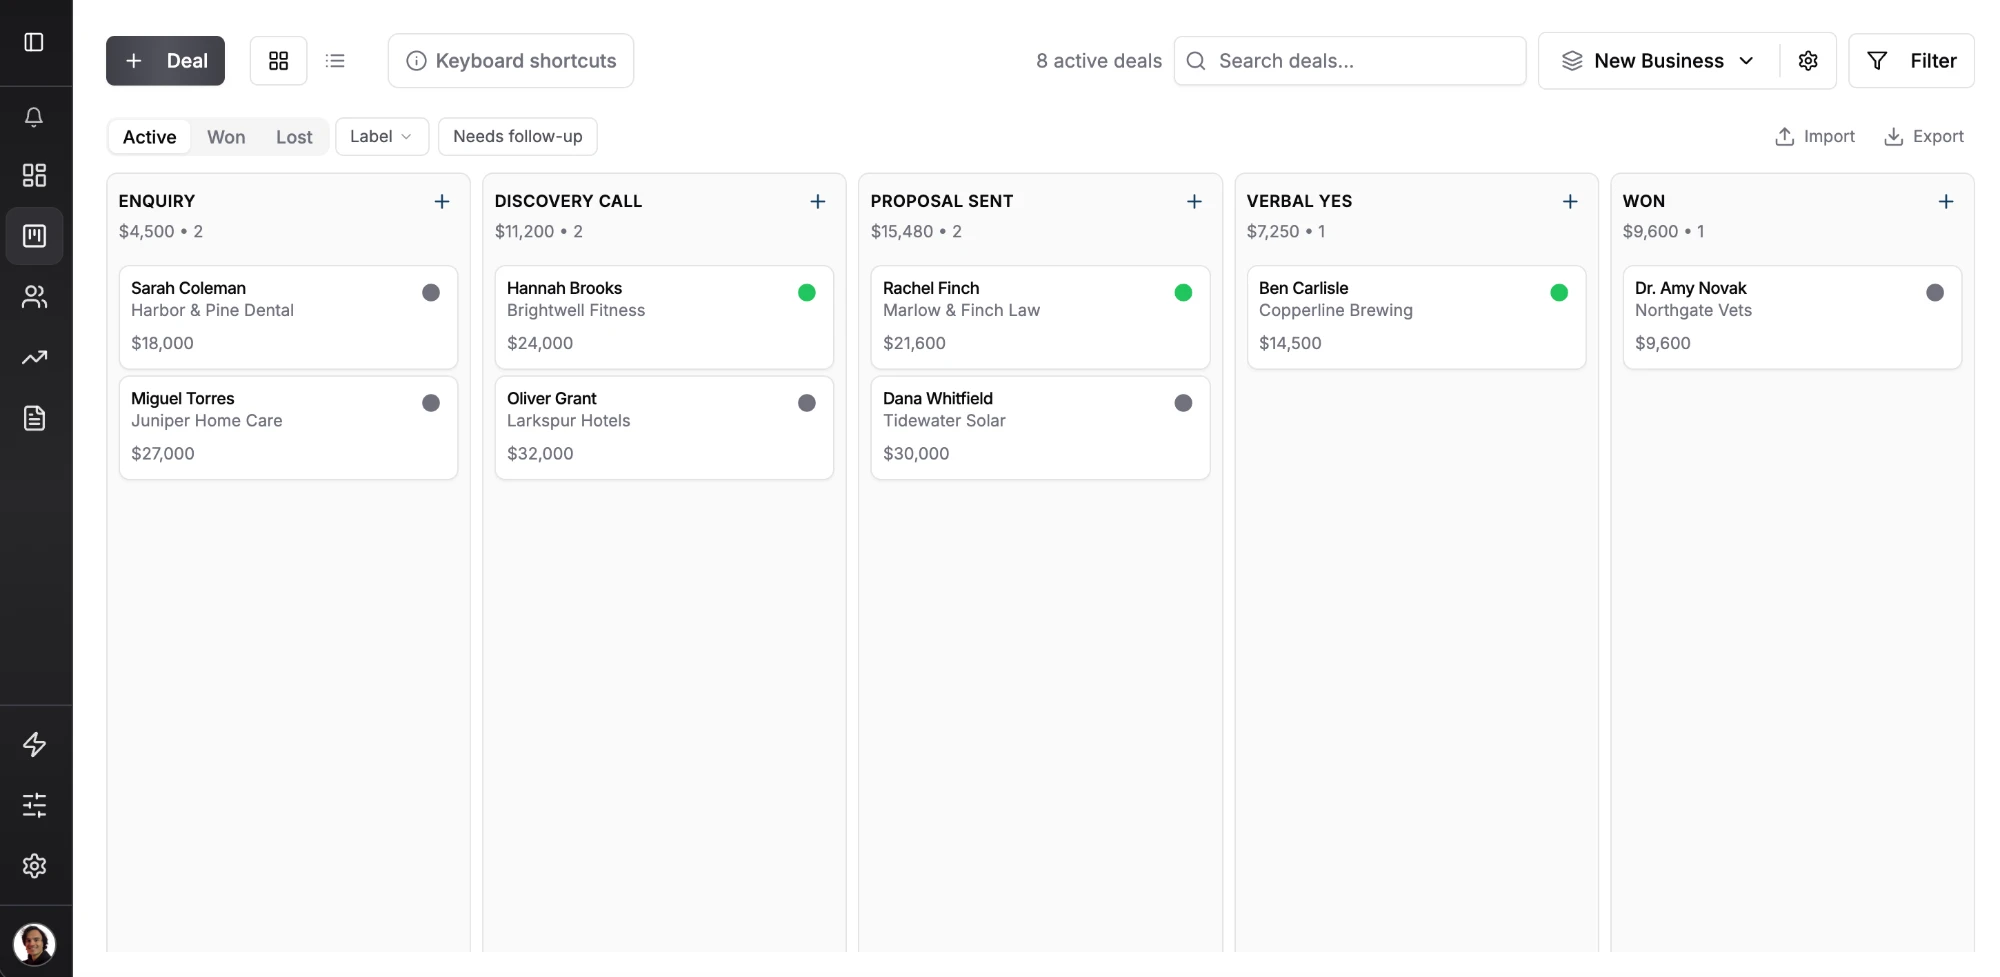
That column total is the weighted value of one stage, and the Won column counts at 100%. It is not a monthly forecast, so for the month-by-month view you still add up by close month as in the table above.
Fluid CRM also has reports and revenue forecasting with a 3-month projection, included on the one plan.
What matters more than the forecast screen is that the board is current. Kon T., CEO of a small business, described that part in a review.
“I can see what is active, what needs follow-up, and where each opportunity stands without digging through emails, notes, or spreadsheets.”
If you are still choosing a tool, we compared the options in our list of the best sales tracking software for small teams.
When a Small Team Does Not Need a Sales Forecast
Some teams should skip forecasting, and it is better to know that now than after building a spreadsheet nobody opens.
- You have fewer than five open deals. You can hold five deals in your head, and percentages on five deals tell you nothing you do not already know.
- Your sales close within a week. If people buy in days, last month’s sales are a better guide to next month than any list of open deals.
- No decision is waiting on the number. A forecast exists to help you decide about a hire, a big cost or how much new business to chase. With no decision to make, it is only admin.
You will also read about other methods. Historical forecasting projects next month from past sales and sales cycle forecasting uses the age of each deal. Statistical and AI models weigh many signals at once.
Those need a few years of clean data and usually a person whose job is to maintain them. A team of 2 to 10 gets most of the value from the stage-weighted table and can look at the others once it has hundreds of closed deals.
Sales Forecasting FAQ
Sales forecasting is estimating how much money you will bring in over a set period, based on the deals you have open today. For a small team that usually means the next one to three months.
The stage-weighted forecast. Multiply each open deal’s value by the chance of closing for its stage, then add the results by the month each deal should close. It needs only a value, a stage and a close month for every deal.
Start with cautious guesses for each stage, such as 10% for a new enquiry and 50% for a verbal yes, and say openly that they are guesses. Replace them with your own numbers once you have about ten closed deals, counting both won and lost.
Rebuild it once a month and update it once a week. The weekly update is quick if stages and close months are already corrected during the team’s pipeline review.
Yes. Six columns are enough, which are deal, value, stage, chance, weighted value and close month. A spreadsheet works well for one person, and it gets harder once several people have to keep the same deals up to date.
Your First Sales Forecast, Start to Finish
List your open deals with a value, a stage and a close month. Multiply each value by the chance of closing for its stage, add the results by month and pull out any deal that makes up more than half of a month.
Count your own percentages from your last closed deals, round them to the nearest 10 and count again every quarter. Then compare each month’s forecast with what you really closed.
Fluid CRM is a simple sales CRM for small teams where the board, the stage percentages and the forecast live in one place, at $16/seat/month or $144/seat/year with every feature included.
Start your 7-day free trial here, no credit card required.