

You worked out your close rate, someone quotes 21% as the B2B average and you still can’t tell if your number is good. The answer depends on what you counted. For a small team it also depends on how few deals the number is based on.
Close rate is won deals divided by every deal started, and win rate is won divided by won plus lost. Published B2B figures run from 21% (HubSpot) to 47% of proposals (RAIN Group). Under 50 closed deals, treat yours as a rough range. Fluid CRM records won and lost as a status, so both counts show in one report.
What Is a Good Close Rate in B2B?
A good B2B close rate is one that beats your own last quarter, counted the same way. The published averages are real, but each one counts something different, and that difference can be bigger than the gap between a strong team and a weak one.
These are the numbers we could trace to a named source.
| Source | Figure | What it counts |
|---|---|---|
| HubSpot Sales Strategy Report | 21% average win rate | Not defined on the page |
| HubSpot Sales Strategy Report | 29% average close rate | Not defined on the page |
| RAIN Group | 47% average | Opportunities that reached a proposal or quote, from 472 sellers and sales executives |
| RAIN Group | 73% elite, 62% top 20%, 40% the rest | Same survey, split by seller performance |
| Matt Dixon and Ted McKenna | 40% to 60% of deals lost to no decision | Deals where the buyer did nothing, from about 2.5 million recorded sales conversations |
RAIN Group only counts deals that reached a proposal, which is why its number is more than double HubSpot’s. A team that wins 21% of everything and 47% of its proposals could be the exact same team.
HubSpot’s close rate is higher than its win rate, which only works if it uses the two words the other way round from the definitions below. That alone is a reason to write your own definition down.
So pick the benchmark that counts what you count, then stop checking it every week. Your trend over three quarters says more than any industry figure. For the wider list, we checked 28 numbers in our post on sales statistics, along with the famous ones nobody can source.
The counts behind your own number live wherever you track deals. A CRM for small sales teams only helps here if marking a deal won or lost takes two seconds, because nobody records a loss that takes two minutes.
Close Rate vs Win Rate vs Conversion Rate
Some pages use these words for the same thing and others use them for different things. Here are the definitions we use. Pick one set and keep it.
| Term | Formula | The question it answers |
|---|---|---|
| Win rate | Won ÷ (won + lost) × 100 | Of the deals that finished, how many did we win? |
| Close rate | Won ÷ all deals started in the period × 100 | Of every deal we started, how many became a customer? |
| Sales conversion rate | Customers ÷ leads × 100, or deals that reached the next stage ÷ deals in this stage × 100 | How many leads become customers, or where in the pipeline deals stop |
| Win loss ratio | Won : lost | How many wins for every loss? |
The difference between win rate and close rate is the deals still open. Win rate ignores them. Close rate counts them as not won yet, which is why close rate drops when a lot of new deals arrive at once.
Write your definition at the top of whatever report you keep. A team that switches from close rate to win rate halfway through the year will see a jump and celebrate a change that never happened. If you do not keep one yet, our sales report template starts with five weekly numbers.
How to Calculate Win Rate (Formula and Example)
Close rate = deals won ÷ all deals started in the period × 100
Win rate = deals won ÷ (deals won + deals lost) × 100
The formulas are the easy part. The choices you make before you count are what make the number honest.
Step 1: decide where counting starts
Pick the point where a lead becomes a real deal, for example after the first discovery call. Skip this and every cold reply that went nowhere counts as a loss.
Step 2: pick the window by close date
Count deals that were won or lost in the last 90 days, by the date they closed rather than the date they were created. A deal created in spring and lost in autumn belongs to autumn’s number.
Step 3: count the deals you won
Only deals marked won count. A verbal yes is still an open deal.
Step 4: count the deals you lost, including the ones that went quiet
Lost to a competitor, lost on price and lost because the buyer stopped answering all go in this pile.
Step 5: divide and multiply by 100
Take a made-up three-person agency over its last 90 days. It won 9 deals, lost 13 to a competitor or on price and closed out 8 that simply went quiet.
Counting the quiet ones as losses, the win rate is 9 ÷ 30 = 30%. Leaving them out, it is 9 ÷ 22 = 41%. Same team and same quarter, 11 points apart, and the only thing that changed was a rule about what counts.
Our free closing ratio calculator does the division. Enter won plus lost deals as the total for win rate, or every deal started for close rate.
What to Count in Your Win Rate on a Small Team
With 20 or 30 deals a quarter, four counting choices move your number more than anything you say on a sales call.
Count no-decision deals as losses
Many win rate guides tell you to leave no-decision deals out. For a small team I think that’s the wrong call, because a deal that drifted away after three calls and a proposal cost you the same hours as one you lost to a competitor.
It’s not a small group either. Dixon and McKenna found that 40% to 60% of deals end with the buyer doing nothing. Leave those out and your win rate only measures how often you beat competitors, while the bigger reason you lose deals stays hidden.
Keep your own separate count of them, a tally or a label, so you can see the pattern. The worst version is the deal that died months ago and was never closed at all, which we showed with numbers in our post on pipeline velocity.
Use a rolling 90 days, not a calendar quarter
A calendar quarter resets to zero on day one, so in week two your win rate rests on three deals. A rolling 90 days always looks back the same distance.
Split by lead source before you split by rep
On a team of three, splitting by rep leaves each person with ten deals and a meaningless number. If referrals close at twice the rate of cold outbound, you want to know that before you spend more on either.
Qualify harder if most losses are no-decision
A pile of no-decision losses usually means deals got in that never had a reason to buy. Ask about budget, timing and what happens if they do nothing on the first call, and close out the ones with no answer.
If price or “we went with someone else” keeps coming up instead, prepare for that one objection, and our list of common sales objections has the scripts we use.
Why Your Win Rate Means Little Under 50 Deals
How many deals did you close last quarter, won and lost together? If the answer is under 50, your win rate is a rough range rather than a score.
Think of a basketball player who makes 3 free throws out of 10. Nobody calls them a 30% shooter yet. Deals follow the same maths, and here is how much one deal moves the number when a team’s true win rate is 25%.
| Closed deals in the window | One deal moves the rate by | Rough range around 25% |
|---|---|---|
| 10 | 10 points | about 0% to 52% |
| 20 | 5 points | about 6% to 44% |
| 50 | 2 points | about 13% to 37% |
| 100 | 1 point | about 16% to 34% |
| 200 | half a point | about 19% to 31% |
The range is a rough 95% band, the spread you can get from chance alone. At 20 deals, a team that truly wins 25% can show anything from about 6% to 44% in a given quarter without changing a thing.
So report the range next to the number, wait for a trend across two or three windows before reacting and pool reps together before you split them.
A drop from 30% to 20% on 20 deals is two deals, which is a reason to look at those two deals rather than rebuild your sales process.
The same noise flows into any forecast built on your win rate, which is why our guide to sales forecasting for small teams uses stage percentages you set yourself.
How to Track Close Rate in a CRM Without Extra Work
Every win rate and close rate depends on one habit, which is closing deals out as won or lost when they end.
In Fluid CRM, won and lost are a status rather than a pipeline stage. You mark a deal Won or Lost, or drag it to Won or Lost on the board. Won and lost deals stay visible on the deals page, and a won/lost report shows both counts over time, so the two inputs to your win rate are always there.
When you mark a deal lost, Fluid CRM asks why, from a list of lost reasons the workspace owner can rename, reorder or archive, and “Other” takes a note. Reports then shows your lost reasons for any date range, so you can see whether no decision, price or a competitor is the bigger pile.
For lead source, add a label like Source:Referral or Source:Outbound to the deal. Labels show on the deal card, like the one in this deal overview.
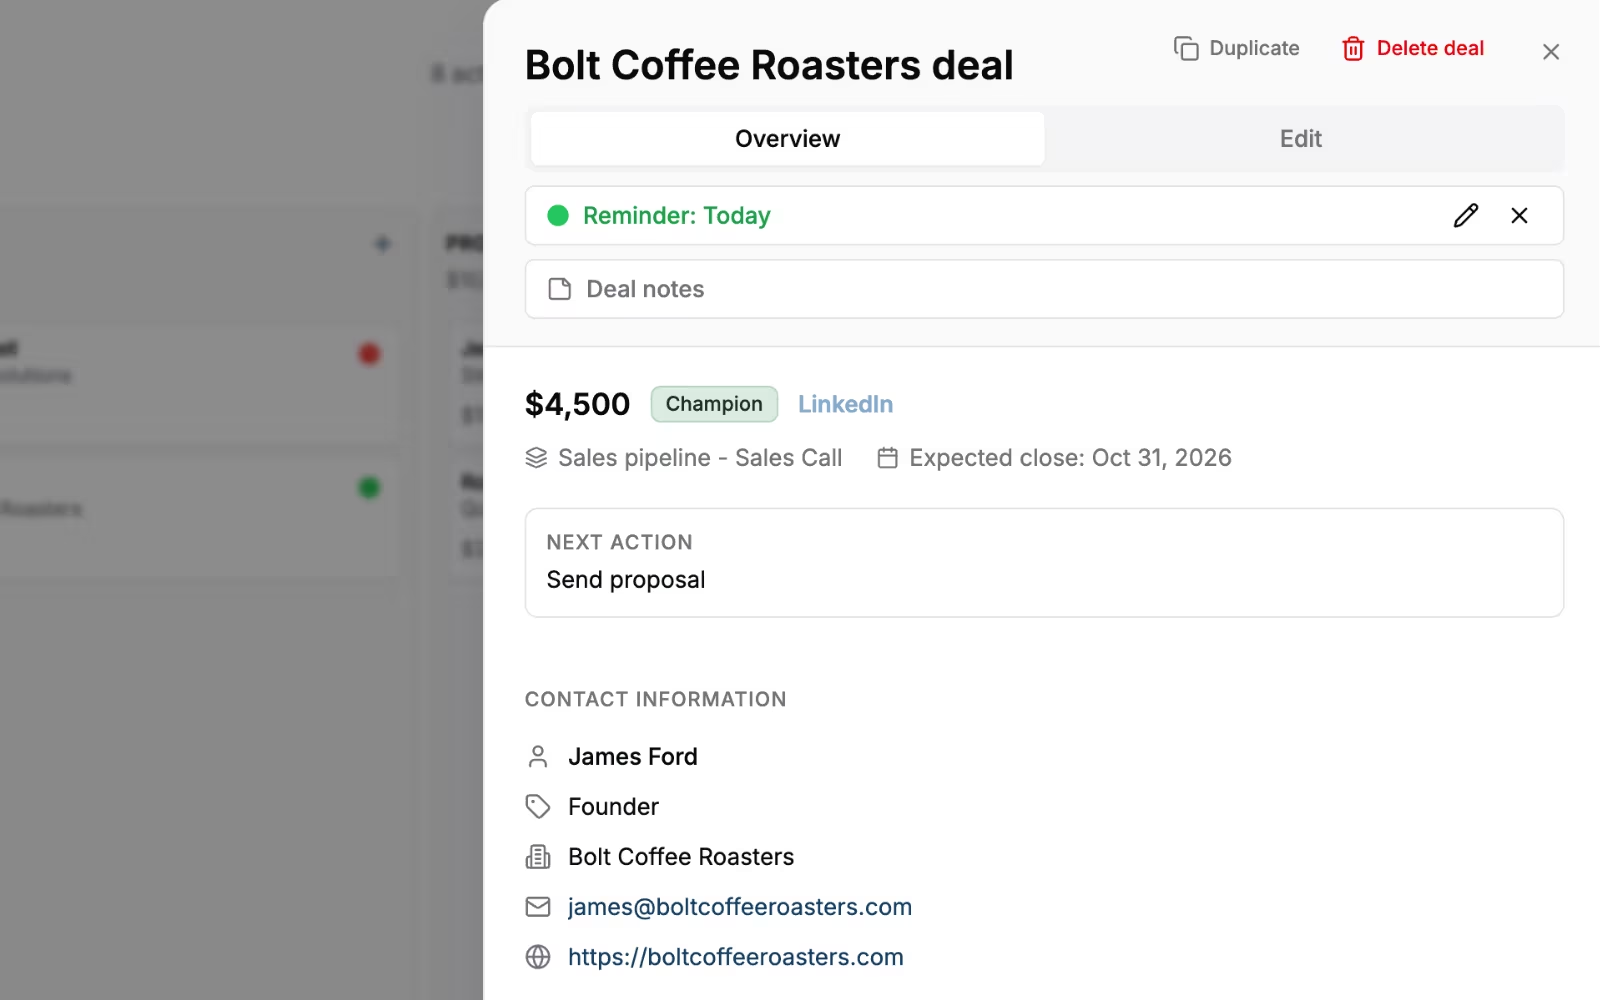
A verified customer who coordinates a European coaching network of about 80 coaches wrote that “Labels follow a Category:Value pattern” and that, combined with the API, “this turns labels into a lightweight structured data layer.” He uses them for certification years and referral routes, and the same pattern works for lead sources.
My old agency Fenixtal booked more than 1,250 sales calls for B2B clients. I generated leads for them and too often they didn’t track them, because they had messy spreadsheets or CRMs people hated using, so there was no close rate to look at.
Once deals are tracked, five minutes of every weekly sales pipeline review spent closing out dead deals keeps the number honest.
Work Out Your Real Win Rate and Close Rate
Pick your definition, count the deals closed in the last 90 days and include the ones that went quiet. For close rate, divide by every deal started in the same 90 days. If that takes more than ten minutes, the problem is where your deals live rather than how you sell.
Fluid CRM is a CRM for small sales teams where closing out a deal is one drag, for $16 per seat per month or $144 per seat per year, with every feature on both.
Start your 7-day free trial here, no credit card required.
Frequently Asked Questions
It depends on where you start counting. HubSpot reports a 21% average win rate and a 29% average close rate, without saying how it counts either, while RAIN Group found 47% for deals that reached a proposal. Compare yourself against your own last three quarters, counted the same way.
Win rate only counts deals that finished, won or lost. Close rate counts every deal started in the period, including the ones still open. That is why close rate is usually the lower of the two.
For a small team, yes. A deal that went quiet after a proposal cost the same time as one lost to a competitor. Keep a separate count of them so you can see how big that group is.
Once a week on a rolling 90 days is enough. Under 50 closed deals, treat the number as a rough range and only react to a trend that holds for two or three windows.
A win loss ratio compares wins to losses, for example 9 wins to 21 losses, which is 9:21 or 0.43. It is the same information as a 30% win rate written as a ratio instead of a percentage.