

You open your CRM dashboard, look at eleven charts and close it again, because none of them says who you owe a call today. Most dashboards are built to answer a manager’s question. On a team of four, the manager is also the person selling.
A CRM dashboard is one screen of live numbers from your CRM. A small team’s should show overdue next steps, next steps due today, active deals, pipeline value and value by stage. Fluid CRM’s dashboard shows those five with no setup.
What a CRM Dashboard Is and How a Sales Dashboard Differs
A CRM dashboard is the summary screen inside your CRM. It reads from your deals and reminders, so nobody has to build the numbers by hand, and they change as soon as someone updates a deal.
A sales dashboard is the wider term. It means sales numbers on one screen wherever that screen lives, including a spreadsheet tab, a separate analytics tool or a TV on the office wall. In a team that keeps all its sales data in the CRM, the two are the same thing, so the rest of this post treats them that way.
The word people mix them up with is report, and the difference is who reads it.
| CRM dashboard | Sales dashboard | Sales report | |
|---|---|---|---|
| Where it lives | Inside your CRM | CRM, spreadsheet or a separate tool | Email, doc or chat message |
| Who reads it | The person doing the selling | Depends on who built it | Someone who wasn’t in the room |
| When you look | Daily | Daily to weekly | Weekly or monthly |
| Question it answers | What do I do now? | How are sales going right now? | What happened, and why? |
If you need the written version, with new deals, wins and losses sent to a cofounder or a boss, use a sales report template. A dashboard is for the person who still has calls to make today.
What a Small Team’s CRM Dashboard Should Show
Read a few guides on this and you’ll see the same split into rep, manager and executive dashboards, with leaderboards, quota gauges and activity counts in each. That split makes sense at a company with 40 sellers and a sales ops person. On a team of four, those screens answer questions nobody in the room needs to ask.
My old agency, Fenixtal, booked 1,250+ sales calls and handed the leads over to clients, so I saw which ones got tracked. I never saw a lead die for lack of a chart. I saw plenty die in the weeks nobody opened the CRM.
So put every widget through one test. If this number changes, what do I do differently? If you have no answer, it doesn’t belong on the screen you open each morning.
Five numbers pass. Two of them are for today and three are for the week.
| Number | How often it matters | What you do when it moves |
|---|---|---|
| Overdue next steps | Every morning | Clear them before anything else, or mark the reminder done and close the deal |
| Next steps due today | Every morning | That is your call list |
| Active deals | Weekly | Too few means prospecting this week, too many means closing out dead ones |
| Pipeline value | Weekly | Two falling weeks in a row means more new deals, not more chasing |
| Value by stage | Weekly | Too much value in one stage tells you which step to work on |
These five are also what the home screen of Fluid CRM, our sales team CRM, shows. The test works on any CRM you already use.
1. Overdue next steps
This number goes first because each one is a promise you already missed. Without opening a tab, can you name the deal you said you’d call back yesterday?
A count on its own isn’t enough. The number has to open the list of deals behind it, or you still have to search the pipeline for names.
2. Next steps due today
The second number is your plan for the day. If it reads 14 and you have 6 hours of calls in you, you find out at 9 a.m. instead of at 5 p.m., and you can move the least urgent ones on purpose.
3. Active deals
A plain count of open deals tells you how much one person is carrying. When it climbs and nothing is closing, some of those deals are probably dead and nobody has said so. Our guide to sales pipeline management covers how to close them out.
4. Pipeline value
Add up the open deals in your sales pipeline and you get the size of what’s open. Check it once a week and look at the direction, because a single large deal can make any one reading look better than it is.
5. Value by stage
One bar chart is worth keeping. If most of the money sits in Proposal, your problem is getting answers on proposals you’ve sent, and finding more leads won’t change that.
What to Leave Off a Small Team’s Sales Dashboard
Most widgets on a typical sales dashboard are useful somewhere, just not on the screen a small team opens first.
| Widget | Why a small team can drop it | Where it goes instead |
|---|---|---|
| Rep leaderboard | With three sellers, everyone already knows who closed what | Nowhere, until the team is bigger |
| Calls and emails sent | Counts effort, and rewards busywork when it’s on show | A one-off check if a seller’s results drop |
| Win rate gauge | On 8 closed deals, one deal going the other way moves 50% to 62.5% | The monthly review |
| Revenue forecast chart | Barely changes from one day to the next | A monthly look |
| Lead source pie | Tells you nothing about today | Your marketing review each quarter |
| Quota gauge | You know your target and roughly where you stand | Your written report |
The forecast matters most of these, because it decides hiring and cash. It needs its own method, which I cover in sales forecasting for small teams, and an hour once a month rather than a glance every morning.
If your team grows to eight or more and a bit of competition would help, a free sales leaderboard does that job without changing your CRM.
How many metrics a sales dashboard should have
Five is enough for a team under 10. HubSpot’s guide says five to seven for a first dashboard and Close says 6 to 10 data points at most. I’d stay at five, because on a team that size you can ask about anything else.
CRM Dashboard Examples for Three Small Teams
A small team needs far fewer dashboard types than most lists show. The table sorts the common ones by whether a team under 10 would use them, and the three examples after it show the screen that’s left.
Sales dashboard types by role
| Dashboard type | What it shows | Does a team under 10 need it? |
|---|---|---|
| Sales pipeline dashboard | Deals and value by stage | Yes, and it’s the base of everything else here |
| Sales rep dashboard | One seller’s deals and due work | Yes, in the form of each person’s own overdue and due-today list |
| Sales activity dashboard | Calls, emails and meetings per person | No, unless you are coaching a new hire |
| Sales manager dashboard | Team results against target | Rarely, since a 15-minute weekly talk covers it |
| Executive dashboard | Revenue trend and targets for leadership | No, your leadership is reading this |
| Sales leaderboard | Sellers ranked on one number | Not below about eight sellers |
| Sales forecast dashboard | Expected revenue by month | Monthly, not on the daily screen |
The examples below use made-up numbers. They show what a good screen looks like on a Monday and what the person does in the next hour. For whole CRM setups rather than single screens, see these CRM examples.
Example 1: solo founder with 14 open deals
| Number | Monday morning |
|---|---|
| Overdue | 2 |
| Due today | 3 |
| Active deals | 14 |
| Pipeline value | $46,000 |
| Largest stage by value | Proposal, $27,000 across 5 deals |
The founder makes the two overdue calls first, then the three due today. Five open proposals account for more than half the money, so the rest of the morning goes to chasing answers on them rather than writing new outreach.
Example 2: owner plus one salesperson
| Number | Owner | Salesperson |
|---|---|---|
| Overdue | 1 | 4 |
| Due today | 2 | 6 |
| Active deals (shared) | 31 | 31 |
| Pipeline value (shared) | $118,000 | $118,000 |
Each person works from their own two numbers and shares the last two. The owner doesn’t need a report on the salesperson. A quick “what’s behind those four?” over coffee does more than any chart, because it gets the reason along with the count.
Tim Chorlton, a Fluid CRM customer who isn’t the person in this example, runs a real version of this setup. He handles his own enquiries while an outside salesperson sells, and he says he has used hundreds of sales CRMs and kept going back to spreadsheets.
He called what he wanted a CRM that is “low touch but highly flexible”, and a two-person dashboard should meet the same bar. If it takes setup and upkeep, you’re back in the spreadsheet by next quarter.
Example 3: four-person agency
| Number | One seller’s Monday |
|---|---|
| Overdue (own deals) | 3 |
| Due today (own deals) | 4 |
| Active deals (team) | 52 |
| Pipeline value (team) | $310,000 |
| Largest stage by value (team) | Proposal, $190,000 across 19 deals |
Each seller clears their own list. The owner looks at the team numbers and sees that more than half the money is waiting on proposals, so this week’s sales meeting has one topic.
Nobody in this example needed a chart of emails sent. The owner found the problem from one stage number and can get the rest by asking.
How to Build a Sales Dashboard in Five Steps
Building a sales dashboard takes less time than choosing what goes on it, so do these steps in order and pick your numbers before you connect anything.
Step 1: write down the question
For a small team, that question is usually “who do I need to talk to today, and is there enough in the pipeline for next month?” If a number doesn’t help answer it, leave it off.
Step 2: pick five numbers at most
Start from the table earlier in this post and swap only when your sales process gives you a real reason. A team with one-call closes might care less about stages, while a team with six-month deals will watch them closely.
Step 3: connect a source
You have three options, and I’d take them in this order.
- Your CRM’s built-in view. Nothing to connect or maintain, so start here.
- A spreadsheet. This is fine up to about 30 open deals, and paying for a CRM before then is often a waste. Our sales tracking spreadsheet gives you the columns.
- A BI tool or a dedicated dashboard tool such as Geckoboard. Wait until someone’s job includes keeping it running, because a broken data connection nobody fixes is worse than no dashboard.
On that spreadsheet’s columns, with stage in D, value in C and next action date in G, three formulas cover most of the screen.
- Overdue:
=COUNTIFS(G:G,"<"&TODAY(),D:D,"<>Won",D:D,"<>Lost") - Due today:
=COUNTIFS(G:G,TODAY(),D:D,"<>Won",D:D,"<>Lost") - Value in one stage:
=SUMIFS(C:C,D:D,"Proposal")
Step 4: decide who keeps the data current
Every dashboard, whatever it cost, shows only what someone entered. If deals move in conversations and nobody updates the record, the screen looks healthy while the real pipeline is somewhere else. Agree on one rule, such as updating a deal before you leave the call.
Step 5: delete what nobody used after two weeks
Ask the team which numbers made them do something in the last two weeks. Take the rest off, since every unused widget makes the ones that matter harder to find.
What the Fluid CRM Dashboard Shows and What It Leaves Out
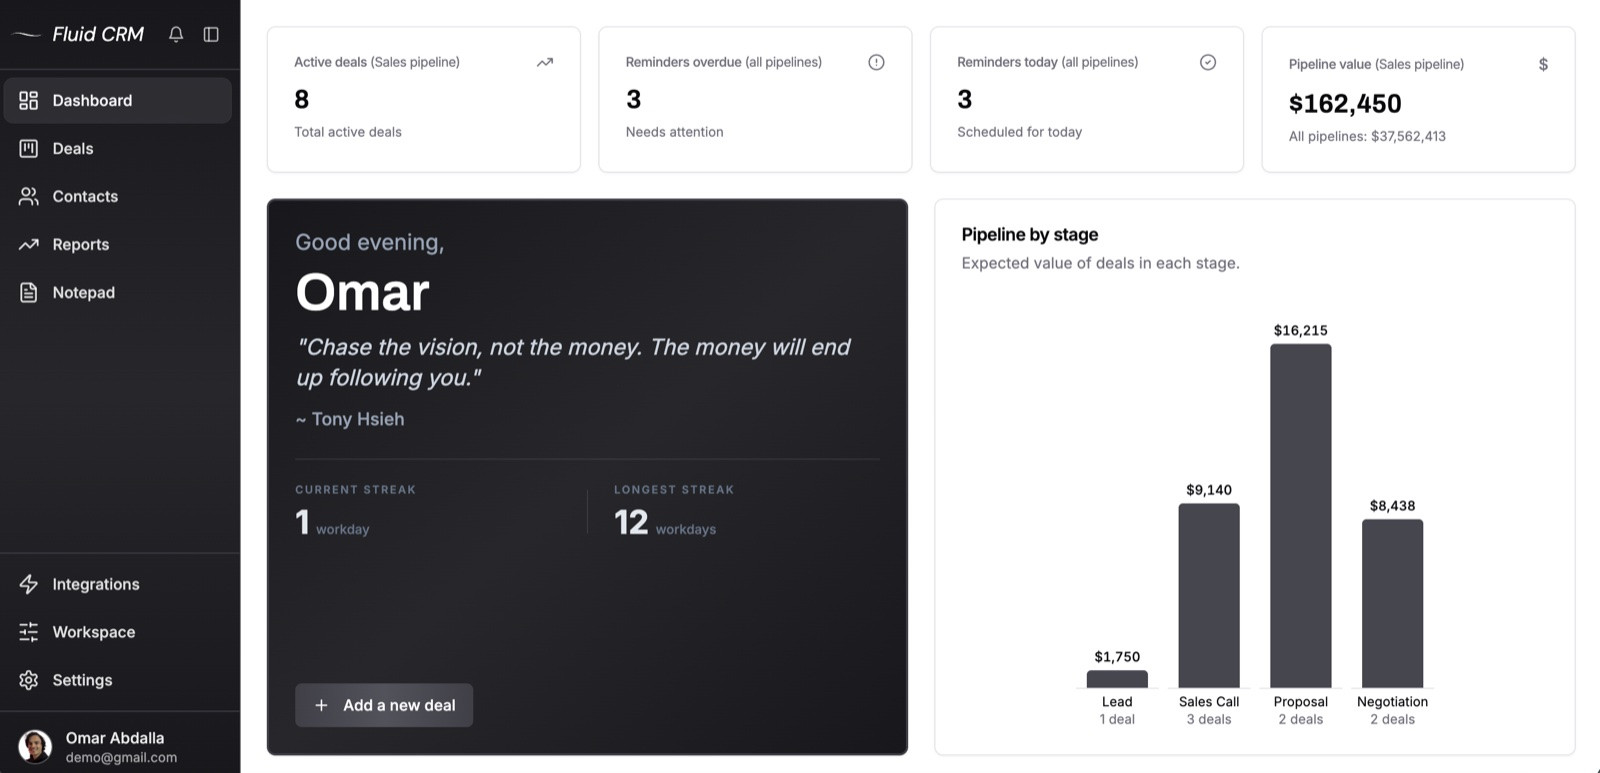
The Fluid CRM dashboard has four tiles and one chart. The two reminder tiles count reminders on deals you own, across all your pipelines, so each person gets their own list. Active deals and pipeline value cover everyone’s deals in the pipeline you’ve selected.
The chart shows expected value, meaning each stage’s total multiplied by its chance of closing. That is why its bars add up to less than the $162,450 on the tile, which is the plain total.
Clicking a reminder tile opens your deals with that reminder, starting with the pipeline that has the most of them. Clicking pipeline value opens the forecast. The dark panel holds a greeting, a daily quote you can hide, a login streak and a button to add a deal.
The email for the days nobody opens the app
A dashboard only helps on the days someone looks at it, and leads die on the days the CRM stays closed. So Fluid CRM also sends a morning email listing what’s overdue and what’s due today, with the contact, the company and the task on each line.
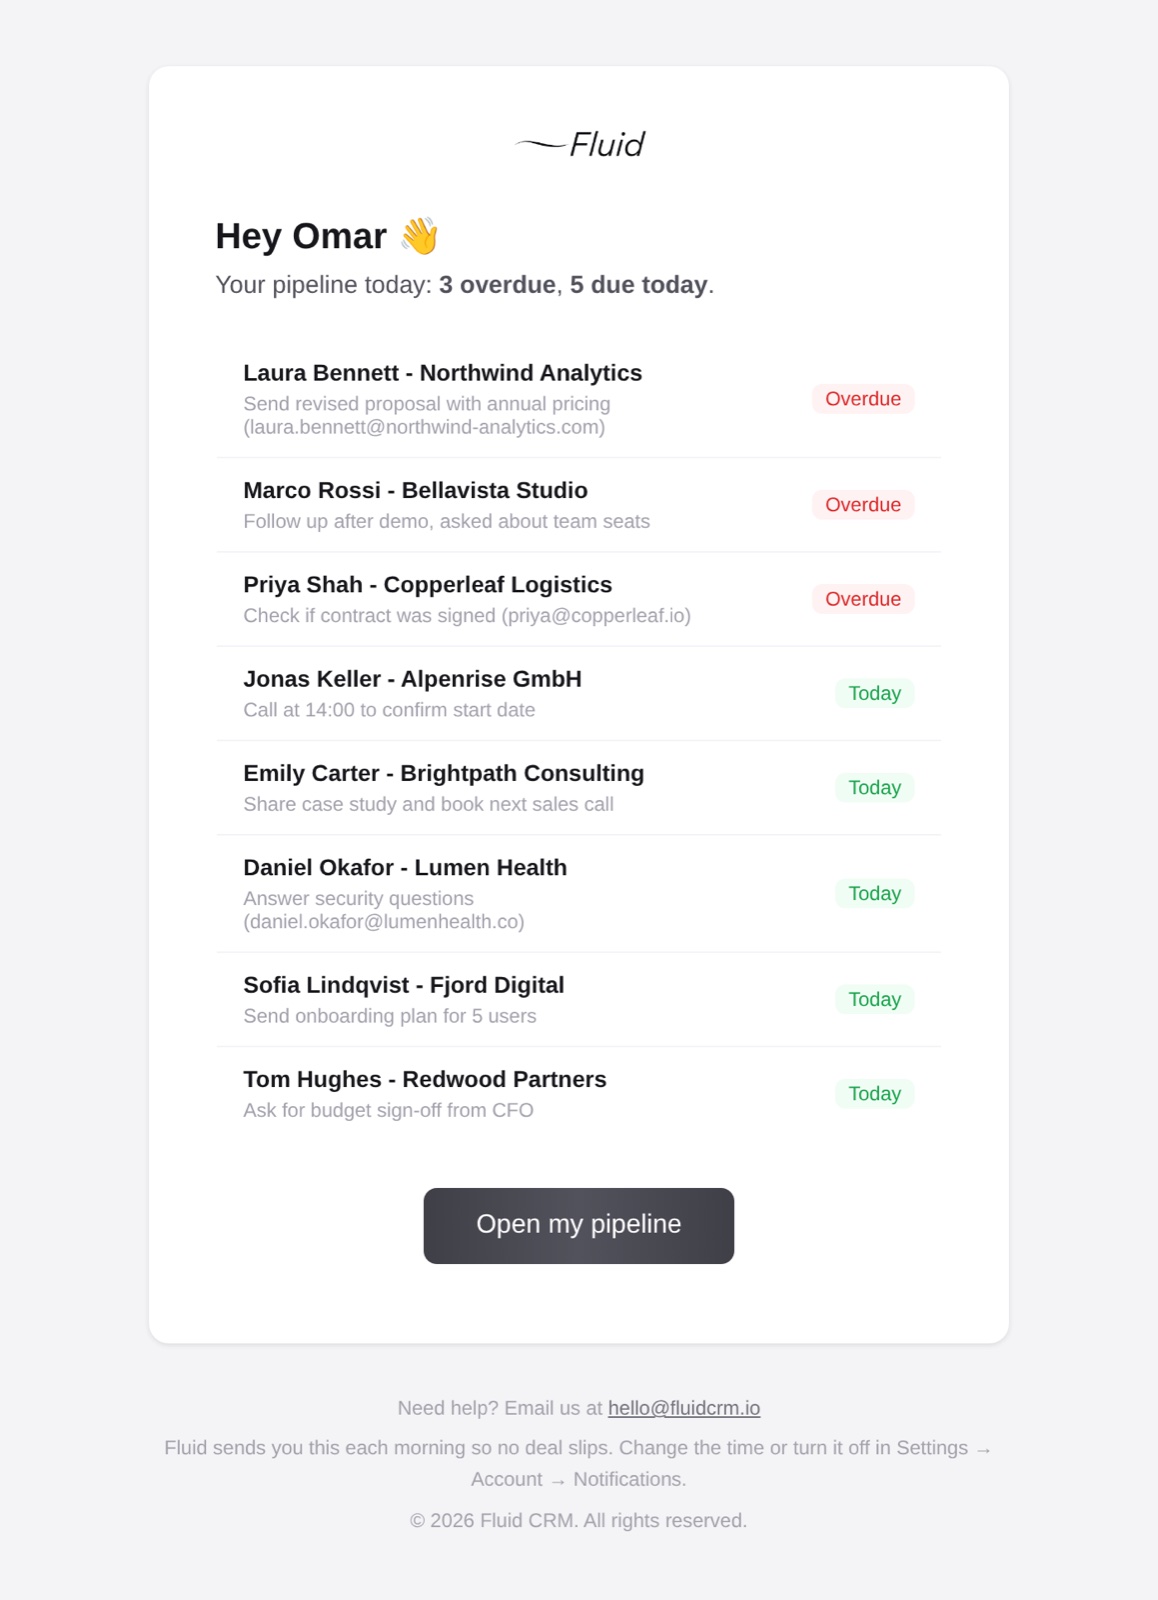
You can read your list in your inbox before you’ve opened anything else. You can change the send time or turn it off in your account settings.
The other half is keeping the numbers current when nobody wants to type. An AI assistant such as Claude or ChatGPT, connected to Fluid CRM through MCP, can update deals and add reminders, so the tiles are right when someone does look.
Two limits to know about
You can’t rearrange the dashboard or add your own widgets, so a team that wants to design its own screen will find this one fixed. There is also no per-user report. If you need to compare sellers side by side each week, Fluid CRM is not the tool for it.
Reports and price
The longer views live in Reports, under Forecast, Results and Lost reasons. Fluid CRM has one plan with every feature in it, at $16 per seat per month or $144 per seat per year, so a 3-person team pays $48 a month.
A verified customer in IT services described the trade this way in a G2 review.
“I’d much rather use something that goes deep on what it does well than something that checks a long list of feature boxes without much depth behind them.”
CRM Dashboard FAQ
For a small team, put overdue next steps, next steps due today, active deals, pipeline value and value by stage on it. The first two tell you what to do today and the other three tell you how the week looks. Larger teams usually add rep comparisons, because a manager there can’t ask everyone in person.
Five is enough for a team under 10. HubSpot’s guide suggests five to seven for a first dashboard and Close suggests no more than 6 to 10 data points. If a number hasn’t changed what anyone did in two weeks, remove it.
Yes, and it works well up to about 30 open deals. COUNTIFS on the next action date gives you overdue and due-today counts, and SUMIFS gives you value by stage. The limit is that a sheet can’t email you the list and only knows what someone typed in.
Under 10 people, usually not, because your CRM’s built-in view covers the numbers you act on. A separate tool starts to make sense when you pull data from several systems or want a screen on the office wall. It also needs someone who keeps the connections working.
Partly. Everyone sees the same screen, but the overdue and due-today tiles count only reminders on deals that person owns, while active deals and pipeline value cover the whole selected pipeline. There is no per-user report and no way to compare sellers side by side.
Cover the Charts on Your CRM Dashboard and Ask This
Open your dashboard, put your hand over every chart and ask who you need to call today. If you can’t answer from what’s left, the screen is built for someone who isn’t on your team.
Fix it with the five numbers above in whatever you use now. If what you use can’t show them without setup, Fluid CRM is a sales team CRM that shows them on day one.
Start your 7-day free trial here, no credit card required.